Improving Air Quality Monitoring with GIS
In today’s world, air quality is more important than ever. As cities grow and industries expand, we need better ways to track air pollution. Geographic Information Systems (GIS) technology is changing how we understand and manage air quality.
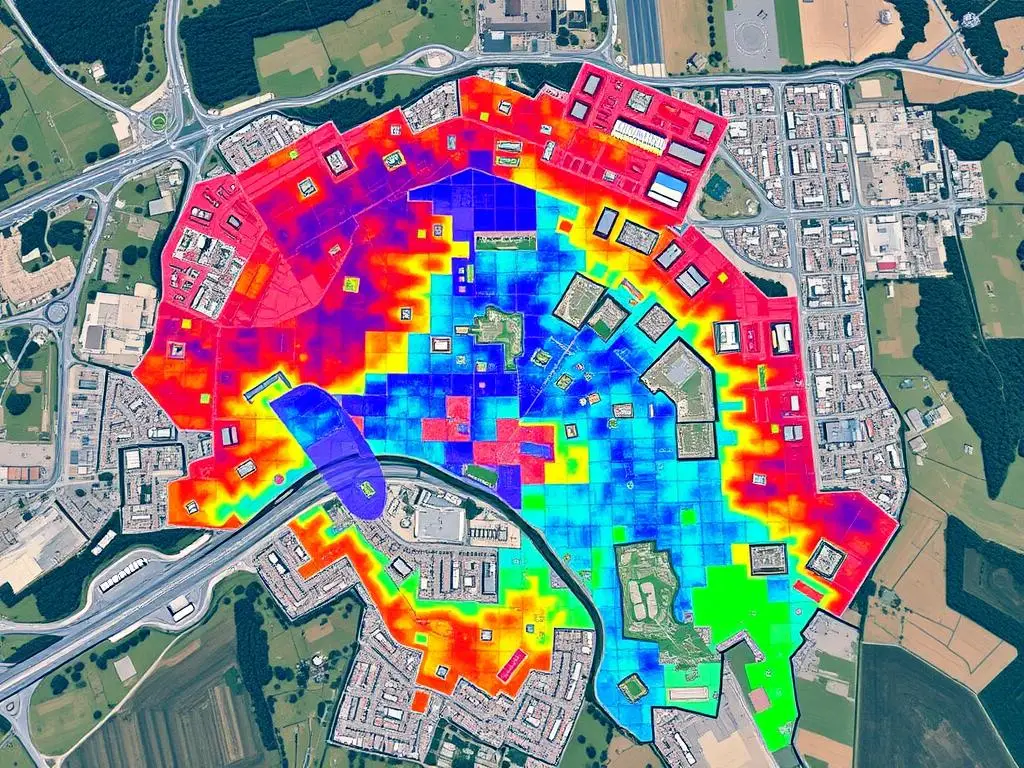
Spatial analysis is key to GIS. It helps us study air pollution’s complex patterns. By using data from sensors, satellites, and more, GIS lets us see and analyze air quality over different areas. This way, we can better understand what affects air quality, like traffic, emissions, and weather.
GIS is making a big difference in air quality monitoring. It helps us find pollution hotspots and see how changes affect air quality. With GIS, air quality management can be more focused and effective, helping communities all over the world.
Key Takeaways
- Spatial analysis and GIS technologies offer a comprehensive approach to understanding and managing air quality.
- Integration of diverse data sources, including ground-based monitoring and satellite imagery, enhances the understanding of air pollution dynamics.
- GIS-based air quality monitoring can inform policy decisions and guide targeted interventions for improving air quality.
- Leveraging the power of spatial analysis can lead to more data-driven and effective air quality management strategies.
- The application of GIS in air quality monitoring has significant implications for public health and environmental sustainability.
Introduction to Spatial Analysis of Air Quality
Improving air quality is a big goal, and spatial analysis is key. It helps us see where air quality is good or bad. This info is vital for making better plans to monitor and map pollution.
Definition of Spatial Analysis
Spatial analysis is all about looking at data about where things are. For air quality, it shows us where pollution is worst. It also helps us see how pollutants move and what causes bad air.
Importance of Air Quality Monitoring
- It tells us how clean our environment is and its health effects.
- It finds areas with lots of pollution that need special help.
- It checks if air quality plans are working.
- It gives insights for making better decisions and using resources wisely.
Using spatial analysis, we can really understand air quality problems. This helps us make better plans to fix them. It’s important for keeping people healthy everywhere.
“Spatial analysis is the key to unlocking the secrets of our air quality and paving the way for a cleaner, healthier future.”
The Role of Geographic Information Systems (GIS)
In the field of environmental data analysis, Geographic Information Systems (GIS) play a key role. They help us understand and tackle air quality issues. GIS combines data from various sources like ground stations, satellites, and more. This creates detailed maps and models of air quality.
Overview of GIS Technologies
GIS platforms are very useful for managing air quality. They let us see, analyze, and understand data about air pollutants. This helps researchers and policymakers spot trends and areas needing improvement.
With GIS, we can layer different data. For example, we can see how population density, traffic, and industry affect air quality. This gives us a clearer picture of what’s impacting the air in a certain area.
Applications in Environmental Studies
- Air quality monitoring and forecasting: GIS tools create real-time air quality maps. This helps us monitor and act early.
- Emission source identification: GIS combines data to find the main sources of pollution. This includes cars, factories, and farms.
- Exposure assessment: GIS models show how much pollution people are exposed to. This helps us target health efforts.
- Scenario planning: GIS tools let us see how different strategies might improve air quality. This includes reducing emissions or using public transport.
The use of GIS tools in environmental data analysis has improved our air quality knowledge. It helps researchers, policymakers, and communities make better decisions. They can then take effective steps to improve the environment.
Key Air Quality Indicators
It’s important to watch the main signs of air quality to know how healthy our environment is. Agencies track pollutants like particulate matter (PM), ozone (O3), nitrogen dioxide (NO2), and carbon monoxide (CO).
Common Pollutants Monitored
- Particulate Matter (PM): These tiny particles can get deep into our lungs, harming our breathing and heart health.
- Ozone (O3): This pollutant is made when chemicals mix together. It can hurt our lungs and make asthma worse.
- Nitrogen Dioxide (NO2): It comes from burning things and can lead to lung infections and lower lung function.
- Carbon Monoxide (CO): This gas is colorless and odorless. It can cut down the oxygen our body needs.
Health Effects of Poor Air Quality
Being around these air pollutants can harm our health, especially for kids, older people, and those with health issues. Long-term exposure can lead to breathing problems, heart disease, and even some cancers.
| Pollutant | Health Impacts |
|---|---|
| Particulate Matter (PM) | Respiratory problems, heart disease, lung cancer |
| Ozone (O3) | Lung irritation, asthma exacerbation, decreased lung function |
| Nitrogen Dioxide (NO2) | Increased risk of lung infections, reduced lung function |
| Carbon Monoxide (CO) | Reduced oxygen supply, cardiovascular problems |
By keeping an eye on these air quality indicators and knowing their health impacts, we can make better air quality plans. This helps protect the health of our communities.
Data Collection Methods for Air Quality
Understanding air quality is key to solving environmental problems. Researchers and policymakers use many ways to collect air quality data. These include traditional ground stations and new satellite technology.
Ground-Based Monitoring Stations
Ground stations have been the main tool for air quality monitoring. They measure pollutants like dust, nitrogen oxides, and ozone. This gives us detailed info on air quality in specific areas.
Satellite Remote Sensing Techniques
New remote sensing tech has changed air quality monitoring. Satellites can now track pollutants over wide areas. This helps us see air quality on a bigger scale, adding to what ground stations tell us.
Mobile Sampling Approaches
- Portable sensors on vehicles or carried by people give us quick, local air quality data.
- These methods are great for finding pollution hotspots and tracking pollutant changes in areas.
- Low-cost, easy-to-use sensors have started community projects. People are now helping with air quality monitoring.
Using different methods, we can get a full picture of air quality. This helps us make better decisions to protect our environment.
| Data Collection Method | Strengths | Limitations |
|---|---|---|
| Ground-Based Monitoring Stations | Precise, localized data; long-term historical trends | Limited spatial coverage; high installation and maintenance costs |
| Satellite Remote Sensing | Broad geographic coverage; ability to monitor regional/global patterns | Coarser resolution; challenges in detecting ground-level pollutants |
| Mobile Sampling Approaches | Highly localized and real-time data; citizen science engagement | Potential for inconsistent data quality; limited historical data |
Analyzing Air Quality Data with GIS
Geographic information systems (GIS) are key in improving air quality monitoring. They help researchers and policymakers understand air pollution patterns. This leads to spotting important trends over time.
Spatial Data Analysis Techniques
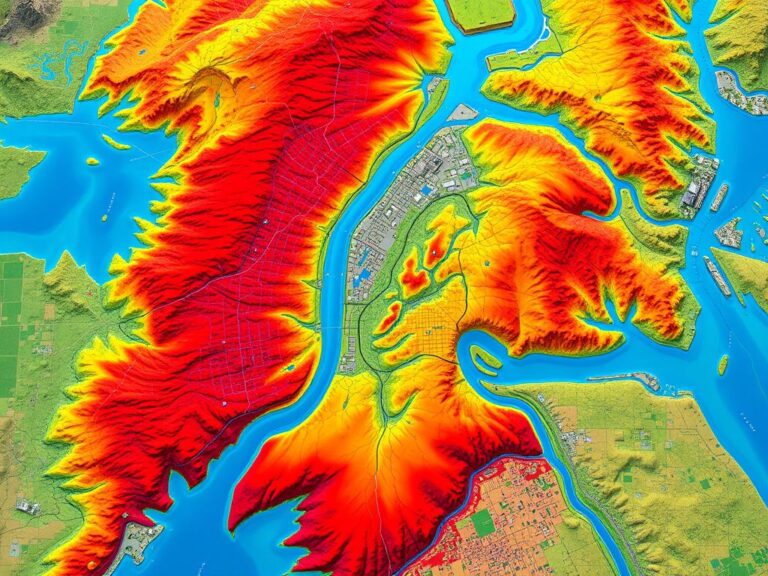
GIS-based analysis offers many tools for studying air quality. It includes mapping pollutant levels, visualizing data, and analyzing hotspots. These methods give a full picture of air pollution’s spread and changes.
- Mapping and visualization: Air quality data mapped helps find high-pollution areas. It shows trends over time and space.
- Spatial interpolation: Algorithms like kriging estimate pollutant levels at unsampled spots. This gives a detailed air quality picture.
- Hotspot analysis: It finds clusters of high or low pollutant levels. This helps target areas for improvement.
Comparing Historical and Current Data
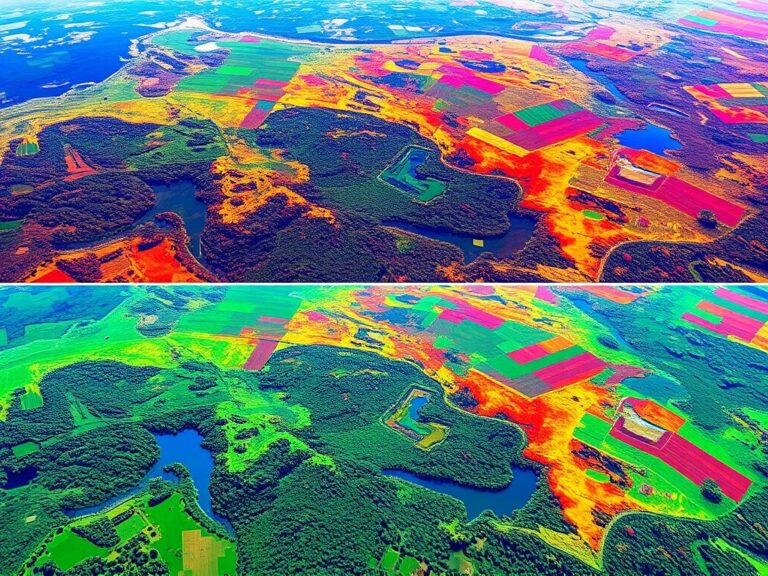
Looking at air quality data over time is key. It shows how well air quality plans work and the effects of policy changes. GIS helps compare old and new data, offering insights.
- Trend analysis: It looks at air pollutant levels over time. This shows if air quality plans are working.
- Spatial-temporal modeling: It combines air quality data with location and time. This gives a full view of air pollution’s movement and changes.
- Change detection: It compares old and new air quality data. This finds where pollutant levels have changed a lot, helping guide decisions.
GIS helps air quality experts understand and manage air quality trends better. This leads to healthier and more sustainable communities.
Case Studies of GIS in Air Quality Management
Geographic Information Systems (GIS) have changed how we handle air quality. They help us use data to make better choices and solve problems. This section looks at how GIS has made a difference in air quality globally and in big cities.
Successful Air Quality Interventions: A Global Perspective
GIS has helped improve air quality worldwide. For example, in Mexico City, GIS helped find and fix pollution problems. By using air quality data and zoning maps, officials could make and enforce rules. This cut down pollution a lot.
In Shanghai, China, GIS helped plan better public transport and encouraged electric cars. This cut down emissions and made air cleaner and easier to get around.
Localized Case Studies in Major Cities
- In London, UK, GIS helps track air quality in real time. This lets the city act fast to reduce pollution. They use traffic rules and tell people about pollution to keep everyone safe.
- In São Paulo, Brazil, GIS shows where pollution is worse. It helps plan where to put parks and green spaces. These areas help clean the air and fight climate change.
- The city of Los Angeles, USA, uses GIS to find areas most affected by pollution. This lets them focus on reducing emissions and working with communities.
These examples show how GIS is changing air quality and health for the better. They show its power in managing air quality and controlling pollution in cities worldwide.

Challenges in Spatial Analysis of Air Quality
Understanding and monitoring air quality with geographic information systems (GIS) is tough. We face big challenges like data integration and the limits of current tech.
Data Integration Issues
Putting together data from different sources is hard in air quality analysis. We get data from ground stations, satellites, and mobile sensors. Each source has its own way of presenting data.
It’s key to make these data sets work together well. Data integration is a big hurdle for researchers and analysts. It’s essential to get a full picture of air quality.
Limitations of Current Technologies
GIS and remote sensing have come a long way. But, they still have technological limitations. For example, satellite data might not show small pollution areas well.
Also, ground stations are not everywhere. This leaves gaps in our data. These gaps make it hard to fully understand air quality.
“Overcoming these challenges is crucial for leveraging the full potential of spatial analysis in air quality monitoring and management.”
We’re working on new ways to solve these problems. The future looks bright for better air quality monitoring. This will help us make policies that protect our health and the environment.
Policy Implications of Air Quality Monitoring
Studying air quality data has big effects on policy and health. Rules and standards help keep communities safe by setting clear goals for clean air.
Regulatory Frameworks and Standards
Many countries have rules to fight pollution. These rules set limits for harmful air pollutants like PM, NOx, and SO2. By analyzing air quality, officials can find problem areas and fix them.
Enhancing Public Health Outcomes
Geospatial analysis helps make better health choices. Air quality regulations based on solid data lead to better solutions. For example:
- Reducing emissions in risky spots
- Encouraging clean energy
- Improving city planning and transport to cut pollution
These actions can greatly improve people’s health. They help lower the risk of lung and heart diseases caused by pollution.
Using spatial analysis in policy-making helps create better plans. This way, governments can tackle air quality issues and protect their people’s health.
Community Engagement and Air Quality
Improving air quality is a team effort, not just for governments. Community involvement is key in tackling this global issue. Citizen science is a growing trend where people help collect and monitor air quality data.
Citizen Science and Data Contribution
Citizen science lets people join in air quality monitoring. They use low-cost sensors and apps to track pollutants in their areas. This approach helps understand air quality better and builds community spirit.
- People can set up air quality sensors in homes, schools, or public places to get real-time data.
- Mobile apps make it easy for folks to record and share air quality info, building a big database.
- The data from these projects adds to what official stations collect, giving a fuller picture of air quality.
Educational Programs for Awareness
Educational programs are also crucial in spreading the word about air quality. They reach out to students, families, businesses, and policymakers.
- Schools teach kids about clean air, pollution sources, and how to reduce their impact.
- Workshops and events teach people how to monitor air quality, find pollution sources, and push for better policies.
- Working with local groups like community centers and environmental groups helps spread awareness further.
Through citizen science and educational programs, communities can fight for cleaner air. This approach empowers people, gathers important data, and shapes policy changes.
Advancements in GIS Technology for Air Quality
Geographic Information Systems (GIS) have seen big changes lately. These changes are changing how we see and study air quality data. They help us make better decisions and raise awareness about air quality.
Innovations in Data Visualization
New ways to show data have come up in GIS technology for air quality. GIS innovations let experts make easy-to-understand visuals. These tools, like interactive maps and 3D models, are changing how we share air quality info.
- Interactive dashboards and dynamic maps that allow users to explore air quality data in real-time
- Augmented reality applications that overlay air quality data onto the physical environment
- Animated visualizations that illustrate the movement and dispersion of pollutants over time
Future Trends in Geospatial Analysis
GIS technology is getting even better, and we’re expecting big changes in air quality monitoring. New trends include using satellite images, mobile sensors, and AI. These will make air quality data more accurate and detailed. Also, more people will be able to help manage air quality thanks to easier GIS tools and community projects.
| Emerging Trend | Potential Impact |
|---|---|
| Satellite-based air quality monitoring | Improved spatial coverage and detection of regional air pollution patterns |
| Distributed sensor networks | Increased data resolution and real-time monitoring of localized air quality issues |
| AI-powered data analysis | Enhanced predictive modeling and early warning systems for air quality events |
Looking ahead, GIS innovations and air quality visualization will be key in fighting air pollution. They will help us understand and tackle air pollution worldwide.
Collaborative Efforts in Air Quality Management
Improving air quality needs teamwork from many groups. Government agencies and non-governmental organizations (NGOs) are key players. They work together, using their skills and resources to better monitor and manage air quality.
Partnerships between Government and NGOs
Government agencies have the rules and power to enforce air quality laws. NGOs, however, excel in community outreach, education, and advocacy. Together, they create strong air quality partnerships to tackle pollution’s many sides.
The Role of Academic Research
Academic groups and research centers are key in studying air quality. They conduct deep studies and develop new tech to understand pollution better. Their findings help shape policies and empower communities to manage air quality wisely.
“Collaborative efforts between government, NGOs, and academia are essential for tackling the complex issue of air pollution. By combining their strengths, we can develop more comprehensive and impactful solutions to safeguard public health and the environment.”
Working together, these groups make a big difference in air quality. By building air quality partnerships and using environmental research, we can achieve cleaner air and a greener future.
Conclusion and Future Directions
As we wrap up our look at spatial analysis in air quality monitoring, it’s clear GIS has changed how we tackle this big issue. By using geospatial data and analysis, we’ve learned a lot about air quality patterns and trends. This knowledge helps us understand air quality on local, regional, and global levels.
Summary of Key Points
In this article, we’ve seen how spatial analysis is key in air quality monitoring. We talked about common pollutants, their health impacts, and how we track air quality. The examples we shared showed how GIS can make a big difference in improving health and the environment.
Call to Action for Improved Air Quality Monitoring
Looking ahead, we need to keep investing in air quality monitoring and spatial analysis. By using GIS and working together, we can do better at tracking and solving air quality problems. We also need to get more people involved, through citizen science and education, to help keep our air clean and our environments healthy.


