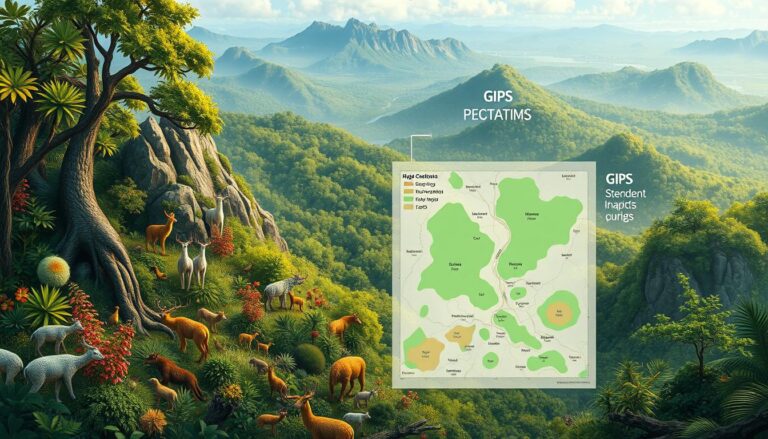
Understanding GIS for Climate Change Impacts
The world is facing big challenges from climate change. We need good data to understand and fight these issues. Geographic Information Systems (GIS) are key in this fight. They help us track and analyze environmental data.
GIS lets us see and understand complex data. This helps scientists, policymakers, and communities tackle climate change. They can make better plans to deal with it.
GIS works by combining data from many sources. This includes satellite images, ground sensors, and old records. It helps find patterns and trends that are hard to see otherwise.
This knowledge is vital for fighting climate change. It helps us plan for rising sea levels, extreme weather, and lost habitats. GIS is a powerful tool in this fight.
Key Takeaways
- GIS provides a comprehensive framework for analyzing and visualizing climate change data
- GIS helps identify patterns, trends, and relationships that inform climate change mitigation and adaptation strategies
- GIS integrates diverse data sources, including satellite imagery and ground-based sensors, to provide a holistic understanding of environmental changes
- GIS enables policymakers and communities to make informed decisions based on accurate, data-driven insights
- Advancements in GIS technology continue to enhance our ability to monitor and respond to the impacts of climate change
What is GIS and Why is it Important?
Geographic Information Systems (GIS) are tools that help us collect, store, and analyze data. They combine different types of data to create detailed analyses. This is key in environmental studies, helping us tackle big issues like climate change.
Definition of GIS
GIS is a computer system that handles spatial data. It helps us understand the Earth’s physical features and the built environment. This way, we can see patterns and trends.
Key Components of GIS
- Spatial data: GIS uses data like maps and GPS to represent the world digitally.
- Hardware and software: It needs special computers and software for managing and analyzing data.
- Analytical tools: GIS has tools for modeling and analysis, helping us find insights in data.
- User interface: It has interfaces that make working with data easy for everyone.
Importance of GIS in Environmental Studies
GIS is vital in environmental studies. It helps us understand and tackle environmental problems. By combining data, GIS shows us important patterns and trends. This is crucial for making smart decisions.
In the fight against climate change, GIS is essential. It helps us see the effects of rising temperatures and extreme weather. It also aids in creating strategies to adapt and mitigate these changes.
| GIS Applications in Environmental Studies | Example Use Cases |
|---|---|
| Land-use planning and management | Identifying suitable sites for renewable energy projects, managing natural resources, and mapping urban development patterns |
| Disaster risk assessment and response | Mapping flood-prone areas, tracking the spread of wildfires, and coordinating emergency response efforts |
| Biodiversity conservation | Monitoring habitat changes, tracking species migration patterns, and designating protected areas |
In summary, GIS is a powerful tool for understanding and addressing environmental challenges. It combines data and offers advanced analysis. This helps researchers, policymakers, and practitioners make informed decisions, benefiting our planet.
The Role of GIS in Climate Change Analysis
Geographic Information Systems (GIS) are key in studying climate change. They use spatial data and analytics to help researchers and policymakers. This way, they can understand climate data and see how global warming affects us.
Understanding Climate Data
GIS helps collect, integrate, and analyze climate data. This includes things like temperature, precipitation, and sea levels. It lets us understand climate trends and what drives them.
Visualizing Climate Change Impacts
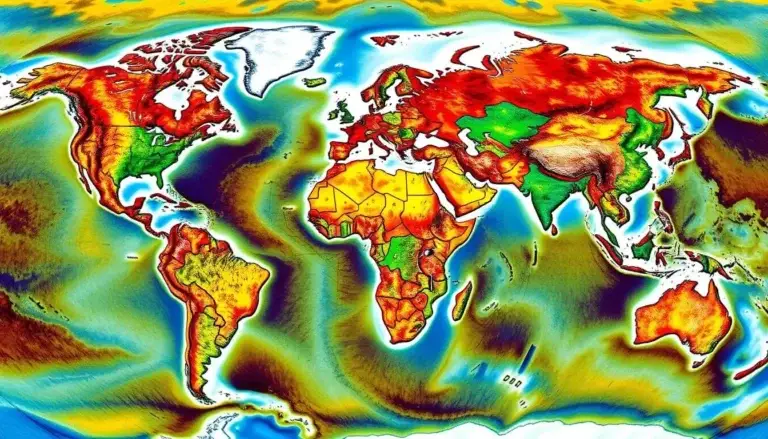
GIS turns complex data into maps and visualizations. Geospatial analysis shows how climate change affects us, like rising seas and melting glaciers. These visuals help people understand and make decisions about climate change.
| Climate Change Impact | GIS Analysis |
|---|---|
| Sea Level Rise | Mapping coastal areas at risk of inundation, modeling future scenarios |
| Drought and Water Scarcity | Monitoring groundwater levels, identifying vulnerable regions |
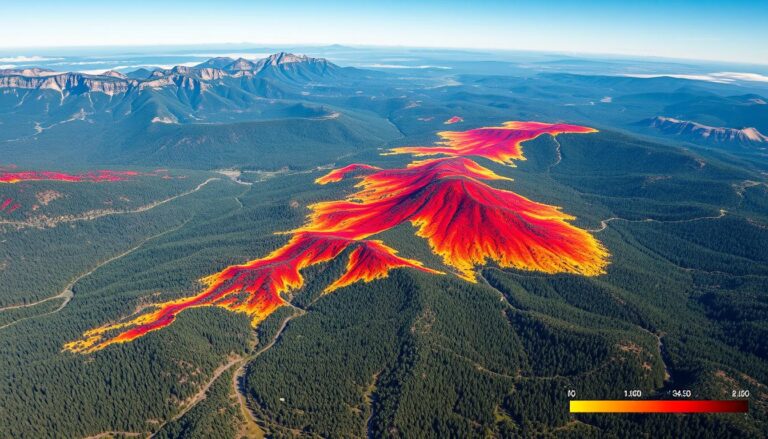
| Wildfire Risk | Assessing fuel loads, mapping fire-prone areas, and planning mitigation strategies |
By using climate data and GIS analysis, we can understand climate change impacts better. This helps us find ways to tackle this global issue.
How GIS Works in Climate Change Research
Geographic Information Systems (GIS) are key in studying climate change. They use spatial data analysis to understand climate patterns and impacts. This helps researchers at different geographic scales.
Data Collection Techniques
GIS uses many data collection methods. These include satellite images, ground stations, and citizen science. These sources give insights into temperature, rain, sea levels, and land use changes. All are important for climate change studies.
Analyzing Spatial Data
After collecting data, GIS helps researchers see and analyze spatial patterns. They can spot trends and predict future changes. Tools like spatial interpolation and predictive modeling reveal how environmental factors and climate phenomena are connected.
Case Studies in Climate Research
GIS has been used in many climate studies around the world. For example, a study in the Arctic mapped glacier and sea ice retreat. This showed the effects of global warming. In Africa, GIS helped model drought risks for farmers, guiding adaptation plans.
GIS is vital in climate research, combining geospatial data for better understanding. It’s crucial for finding ways to fight and adapt to climate change. As research evolves, GIS will play an even bigger role in solving this major challenge.
Tools and Software Used in GIS
Geospatial Information Systems (GIS) play a key role in climate change research. They offer tools for analyzing, visualizing, and modeling data. As climate science grows, so does the variety of GIS software available.
Popular GIS Software Options
Some top GIS software for climate analysis are:
- ArcGIS: Developed by Esri, it’s a leading suite of GIS tools. It has strong data management, analysis, and mapping features.
- QGIS: An open-source GIS with a user-friendly interface. It’s known for its affordability and flexibility, making it a favorite among researchers.
- Google Earth Engine: A cloud-based platform for accessing and analyzing geospatial data. It’s great for various applications, including climate data.
- GRASS GIS: An open-source GIS focused on raster data processing. It’s ideal for climate data analysis and modeling.
Open Source vs. Proprietary Tools
Researchers can choose between open-source and proprietary GIS software. Open-source options like QGIS and GRASS GIS are cost-effective and customizable. They let researchers adapt the software to their needs. On the other hand, proprietary tools like ArcGIS have advanced features and dedicated support.
| Feature | Open-Source GIS | Proprietary GIS |
|---|---|---|
| Cost | Free or low-cost | Subscription-based or one-time purchase |
| Customization | Highly customizable | Limited customization options |
| Support | Community-driven support | Dedicated support from the vendor |
| Integration | May require additional plugins or workarounds | Seamless integration with other software |
The choice between open-source and proprietary GIS tools depends on the research team’s needs and resources. By considering the advantages and disadvantages of each, scientists can pick the best software for their project.
Applications of GIS in Climate Change Adaptation
Geographic Information Systems (GIS) are key in fighting climate change. They help in planning for a changing world. GIS is used in urban planning, managing natural resources, and more.
Urban Planning and Resilience
Urban areas face big challenges from climate change. GIS helps create plans to adapt. It looks at population, infrastructure, and the environment.
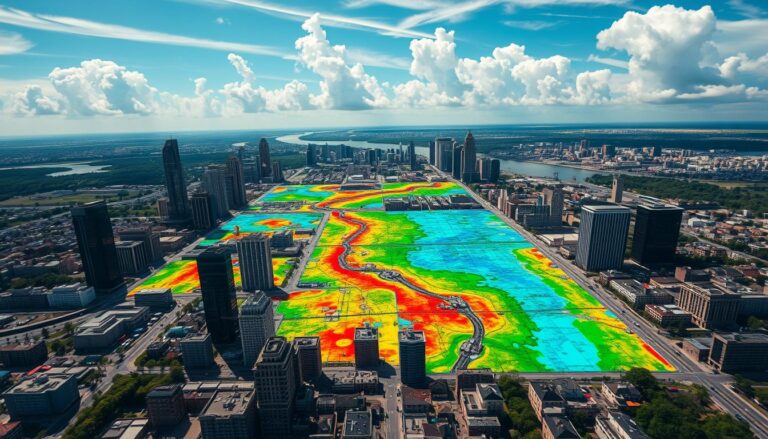
Planners use GIS to find weak spots and make cities stronger. They build cities that can handle rising sea levels and extreme weather. GIS helps make cities sustainable and resilient.
Natural Resource Management
GIS is also vital for managing natural resources. It helps track the health of ecosystems. This way, managers can make smart choices about land and resources.
GIS shows changes in plants, animals, and water. It helps protect these important parts of our world. This is key for climate change adaptation.
| GIS Application | Benefits for Climate Change Adaptation |
|---|---|
| Urban Planning | Identify vulnerable areas, design resilient infrastructure, and promote sustainable development |
| Natural Resource Management | Monitor ecosystem health, inform conservation efforts, and optimize resource allocation |
As climate change gets worse, GIS will play an even bigger role. It uses spatial data to help solve the climate crisis. This way, we can build a better, more sustainable future for all.
Mapping Vulnerabilities and Risks
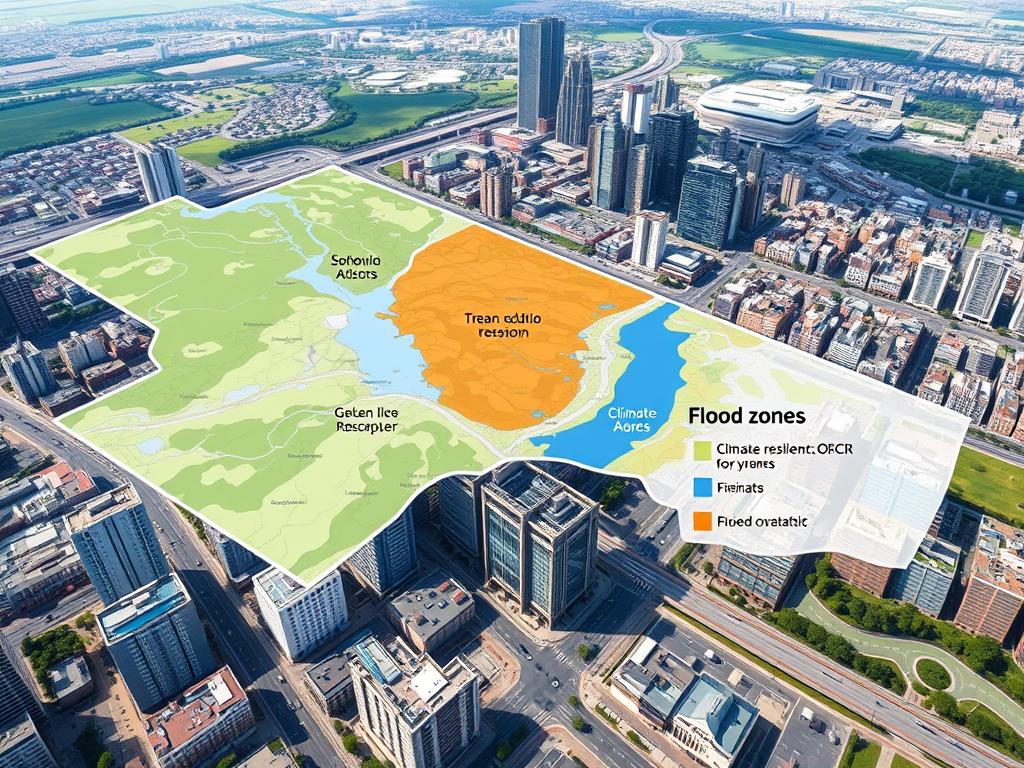
Geographic Information Systems (GIS) are key in fighting climate change. They help map out areas most at risk from climate change. This is vital for planning how to adapt and where to focus resources.
Identifying At-Risk Areas
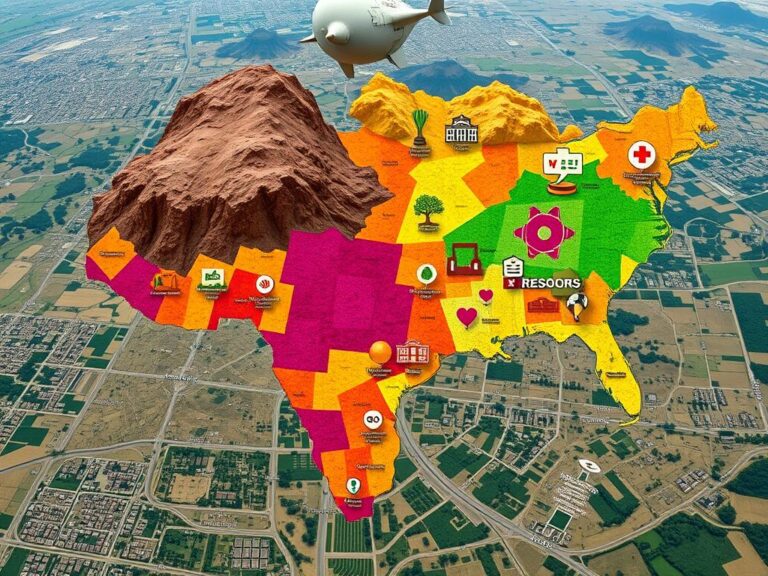
GIS lets experts combine different data layers. This includes climate forecasts, population stats, and info on buildings. It shows where sea levels, extreme weather, and droughts might hit hardest. This way, leaders can decide where to put their efforts to fight climate change.
Community Engagement in Mapping Efforts
Good risk mapping needs teamwork with local people. They share important details about their challenges. This local wisdom makes the maps more accurate and helps find better solutions for everyone.
“Engaging with local communities is essential for understanding the nuanced impacts of climate change and developing tailored responses that address their specific needs.”
GIS and Climate Policy Development
Climate policy decisions affect our planet and communities deeply. GIS analysis helps make these important choices. It uses spatial data and mapping to give insights to policymakers.
Informing Policy Decisions
GIS analysis helps understand climate patterns and their effects. It shows where risks are high and where to focus efforts. This way, policymakers can make climate policies based on science and local needs.
Case Studies of Successful Policy Implementation
GIS has changed climate policies in many places. In the Netherlands, GIS helped create the Delta Plan to fight sea level rise. In New York City, GIS mapped heat islands and vulnerable areas to improve resilience.
| Case Study | GIS Application | Policy Outcome |
|---|---|---|
| The Netherlands’ Delta Plan | Mapping coastal regions, flood risks, and infrastructure | Comprehensive strategy to protect coastal communities from climate change impacts |
| New York City Resilience Initiatives | Identifying urban heat islands and socially vulnerable areas | Targeted programs to safeguard at-risk neighborhoods from climate-related threats |
These examples show GIS’s role in shaping climate policies. It leads to effective, data-driven solutions. By using GIS, we can build a more resilient and sustainable future.
Future Trends in GIS for Climate Change
Climate change is a big challenge worldwide. GIS technology is playing a key role in studying and analyzing it. With new GIS tech and artificial intelligence, we’ll see big changes in how we tackle climate change.
Advances in GIS Technology
GIS is always getting better, thanks to new ways to collect, process, and show data. Technologies like remote sensing and satellite imagery are making climate data better. This means we can predict climate patterns more accurately.
Integrating AI with GIS
GIS and AI together will change how we study climate change. Machine learning helps GIS find patterns and predict the future. This makes it easier to make smart choices about climate change.
By combining GIS technology and artificial intelligence, we can understand climate change better. This will help us come up with better ways to deal with it.
“The future of GIS in climate change analysis lies in its ability to seamlessly integrate with emerging technologies, empowering us to make more informed and data-driven decisions.”
Challenges in Using GIS for Climate Change
GIS technology is vital in climate change research but faces big challenges. The main issues are data quality and accessibility and the need for technical skills and capacity building.
Data Quality and Accessibility
Using GIS for climate change analysis is tough due to quality and availability of climate data. The data can be wrong, missing, or not accurate. This makes GIS assessments less reliable.
To fix this, we need better data management and high-quality data collection. Also, making climate data more accessible is key, especially for developing countries and underserved communities.
Technical Skills and Capacity Building
GIS for climate change needs special technical skills. These include knowledge of Geographic Information Systems, data analysis, and climate science. But, there’s a lack of experts with these skills.
Investing in capacity building and training is essential. It helps more people use GIS in climate change work.
Overcoming these challenges is vital for GIS to fully help with climate change. Working together, we can improve data quality, accessibility, and skills.
Conclusion: The Future of GIS in Combating Climate Change
Geographic Information Systems (GIS) are key in fighting climate change. They help us understand and see the effects of climate change. As we move forward, GIS will play an even bigger role in solving this global problem.
Final Thoughts on GIS’s Role
GIS technology is getting better, and we have more climate data than ever. This means we can better understand and fight climate change. As GIS keeps improving, experts and leaders will make smarter choices and find better ways to solve climate issues.
Encouraging Collaborative Efforts
Beating climate change needs everyone working together. GIS can bring different groups together. By sharing GIS data and ideas, we can use everyone’s skills to fight climate change. This teamwork is crucial for a sustainable future.


