Climate Vulnerability Mapping: Assessing and Addressing Risks
The world is facing a big challenge with climate change. It poses risks to communities everywhere. To tackle these risks, climate vulnerability mapping is key. It uses Geographic Information Systems (GIS) technology to understand and address environmental threats.
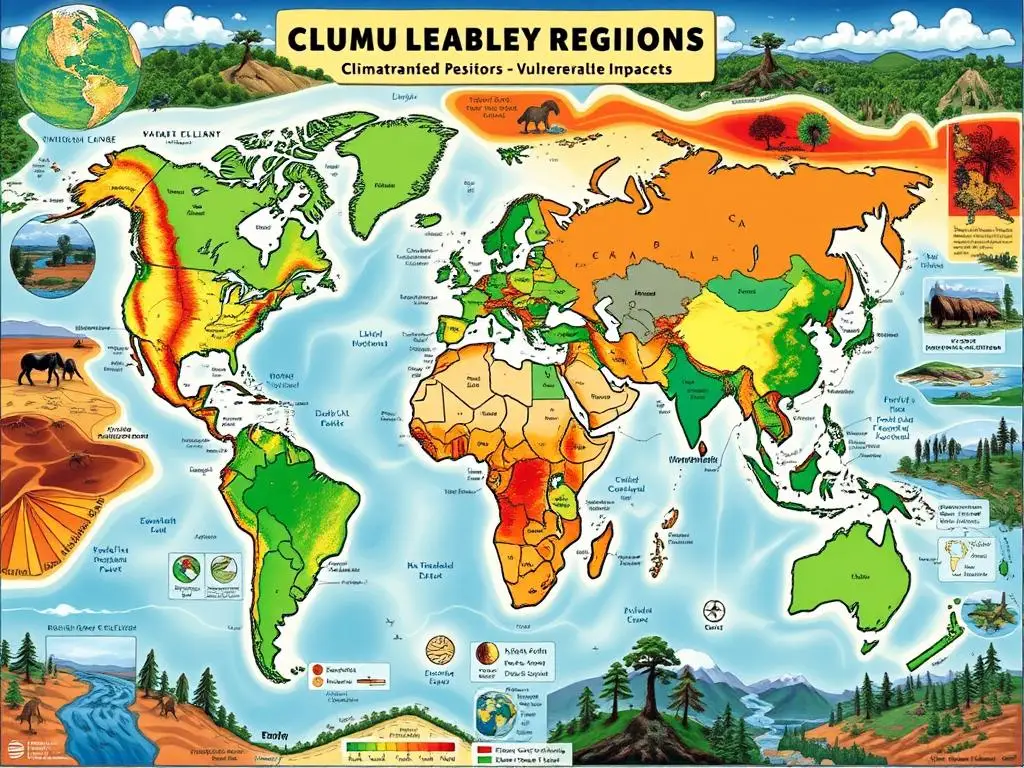
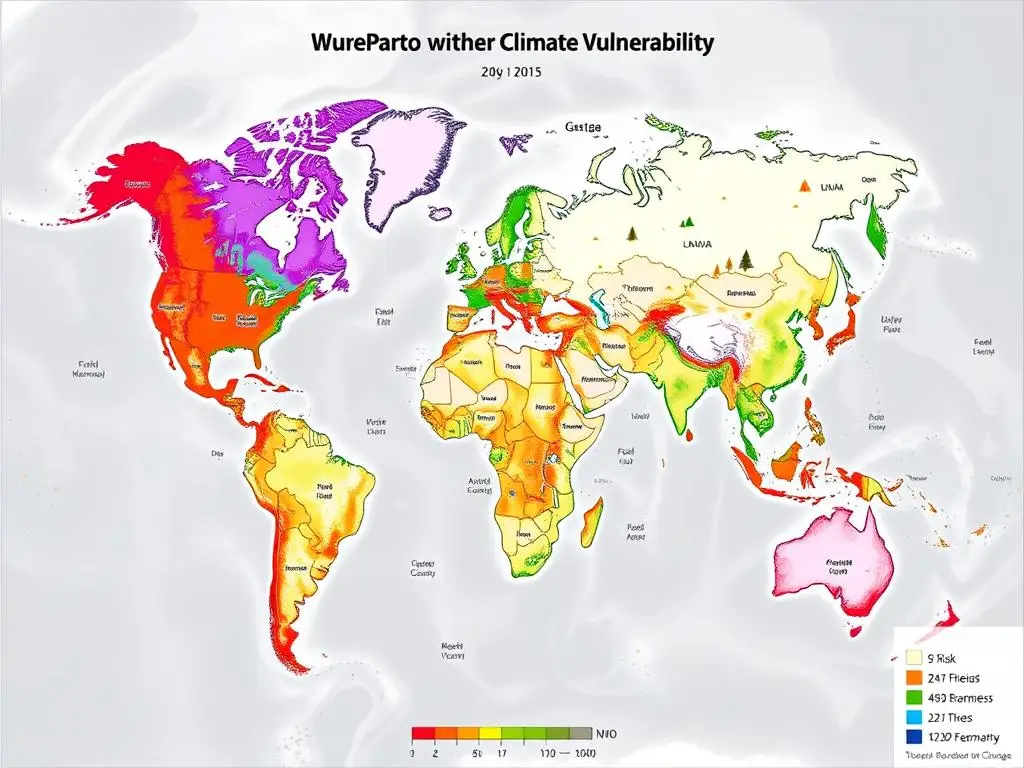
Climate vulnerability mapping uses GIS and remote sensing data. It finds areas most at risk from climate change, like flooding and drought. By looking at environmental and social factors, it helps communities focus on the most vulnerable areas. This guides efforts to adapt and build resilience.
This mapping helps shape policy and emergency plans. It shows where risks are highest, helping protect vulnerable areas. The data also helps develop strong adaptation measures. This way, communities can better face climate challenges.
Key Takeaways
- Climate vulnerability mapping uses GIS technology to identify areas at risk from environmental threats
- This approach analyzes various factors to pinpoint the most vulnerable regions and populations
- The insights from climate vulnerability mapping can guide policy decisions, urban planning, and resilience-building efforts
- Effective climate vulnerability mapping empowers communities to develop targeted adaptation strategies
- Addressing climate risks through this mapping process is crucial for building resilient communities
Understanding Climate Vulnerability
Our world is facing big challenges from climate change. The idea of climate vulnerability is key. It shows how much harm a place can get from climate issues like extreme weather and rising sea levels.
What Is Climate Vulnerability?
Climate vulnerability means how open a place is to climate dangers. It also shows how well a community can handle these risks. Many things affect this, like the area’s environment, money situation, and resources.
Why It Matters for Communities
Knowing about climate vulnerability helps communities plan for the future. Places that are more vulnerable face bigger risks. By working on these issues, communities can get stronger and be ready for what’s coming.
The Role of Geographic Information Systems (GIS)
GIS tools are very important for seeing climate vulnerability. They mix different kinds of data to make detailed maps. These maps show where the biggest risks are, helping communities make smart plans.
GIS helps communities understand their climate risks. This way, they can take steps to protect their people from climate dangers.
The Importance of Climate Vulnerability Mapping
Climate vulnerability mapping is key for spotting areas at risk. It helps in making policy and planning decisions. It also boosts community resilience. By seeing how climate change affects areas, communities can focus on the most critical needs.
Identifying At-Risk Areas
This mapping tool helps find out which places face the biggest climate challenges. It shows where flooding, drought, heatwaves, or other extreme weather might hit hard. Knowing these spots helps communities direct their efforts and resources where they’re most needed.
Informing Policy and Planning
Climate mapping gives policymakers valuable insights. They can use this data to build stronger infrastructure and set zoning laws. It also helps in creating early warning systems for disasters. Mapping climate effects is vital for risk assessment and policy planning.
Enhancing Community Resilience
Understanding climate risks lets communities take action to become more resilient. They might invest in green projects, adopt sustainable land use, or improve emergency responses. Climate mapping gives communities the power to make smart choices and lead their own resilience efforts.
“Climate vulnerability mapping is a powerful tool that can help communities prepare for and adapt to the impacts of climate change. By identifying areas at risk and informing policy decisions, we can build a more resilient future.”
Tools and Technologies for Climate Mapping
In today’s world, we rely on data to make smart choices. Many tools and technologies help us understand and tackle climate change risks. These tools help communities grasp and tackle the dangers of climate change.
Overview of GIS Software
Geographic Information Systems (GIS) software is key for mapping climate risks. It lets users handle and analyze data, showing complex climate patterns. ArcGIS, QGIS, and Google Earth Engine are top choices, offering many features for climate planning.
Remote Sensing Technologies
Remote sensing, like satellites and drones, is vital for climate mapping. It gives detailed data on the environment, land use, and more. By combining this data with GIS, we get insights for climate adaptation.
Open-Source Tools
- Open-source mapping tools like QGIS, OpenStreetMap, and Google Earth Engine are also important. They offer strong data management and analysis, often for free.
- These tools make it easier for everyone to work on climate mapping. They help communities and groups with less money to join in.
Using GIS, remote sensing, and open-source tools helps us understand climate risks better. These tools help us spot danger zones, make better policies, and plan for a safer future.
The Process of Climate Vulnerability Mapping
Making climate vulnerability maps is a detailed process. It includes collecting data, analyzing it, and interpreting the results. This ensures the maps help communities deal with climate changes.
Data Collection Methods
The first step is to gather important data. This data comes from government records, scientific studies, and local sources. Using GIS technology, mapmakers combine this data to show a region’s vulnerability.
Analysis Techniques Used
After collecting data, advanced climate analysis techniques are applied. Tools like spatial analysis and statistical models help find patterns. This way, mapmakers can spot the biggest climate risks for a community.
Interpreting the Results
The last step is to understand the data. Mapmakers turn complex data into clear visuals and stories. This helps guide policy and action to tackle climate risks.
| Data Collection Methods | Analysis Techniques | Interpretation of Results |
|---|---|---|
|
|
|
This detailed method helps communities understand their climate risks. It guides them in building resilience and adapting to climate changes.
Key Indicators of Vulnerability
Understanding climate vulnerability means looking at many factors. These include socioeconomic, environmental, and infrastructure risks. Each plays a big role in how well a community can handle climate-related dangers.
Socioeconomic Factors
Socioeconomic factors are key in climate vulnerability. Poverty, income gaps, education, and healthcare access matter a lot. Communities with less money and resources struggle more with climate change.
Environmental Indicators
Environmental factors are also vital. They include natural disasters, extreme weather, and ecosystem health. Places hit by hurricanes, floods, or wildfires face big climate risks.
Infrastructure Risks
Infrastructure is crucial for climate resilience. The state of buildings, roads, utilities, and communications matters a lot. Poor infrastructure can make climate impacts worse, disrupting services and weakening communities.
By focusing on these indicators, leaders can create plans to help their communities. This way, they can build stronger defenses against climate change.
Case Studies in Climate Vulnerability Mapping
Climate vulnerability mapping is a key tool for local governments and communities worldwide. It helps them understand and tackle climate change risks. By using GIS and various data, these efforts pinpoint at-risk areas. They also guide policy, planning, and boost community resilience.
Success Stories from Local Governments
In Portland, Oregon, the city teamed up with researchers for a climate vulnerability assessment. The mapping showed some neighborhoods were hit hard by climate change, like heatwaves and flooding. With this info, Portland focused on upgrading infrastructure and helping vulnerable communities.
Lessons Learned from Global Examples
- In the United Kingdom, Manchester used mapping to shape its adaptation strategy. It focused on protecting critical infrastructure and vulnerable areas.
- In Australia, Victoria used mapping to spot bushfire risks. This helped in planning and responding to emergencies more effectively.
- The city of Durban, South Africa, included mapping in its development plans. It ensured infrastructure and land-use decisions considered climate impacts.
The Impact of Mapping on Policy Change
These examples show how climate vulnerability mapping changes policy and drives action. It gives local governments the data they need to adapt to climate change. This helps them allocate resources better and work with communities to build resilience. As climate change worsens, mapping’s role in policy and planning will grow even more important.

Engaging Stakeholders in Vulnerability Mapping
Effective climate vulnerability mapping needs the help of many stakeholders. By working together, local communities, NGOs, academics, and government agencies can make the process better. This way, we can tackle climate challenges more effectively.
Involving Local Communities
Local communities are key to any vulnerability mapping effort. They know the challenges they face best. Their insights are crucial for spotting high-risk areas and finding solutions.
By involving them through focus groups and workshops, we empower them. This ensures the mapping reflects their needs accurately.
Collaborating with NGOs and Academics
NGOs and academics add a lot to the table. NGO collaboration connects policymakers with community groups. This ensures the mapping is based on real community needs.
Academic partnerships bring in the latest research and tools. They help make the mapping more reliable and thorough.
The Role of Government Agencies
Government agencies are vital for stakeholder engagement. They provide funding, data, and policy support. This helps coordinate efforts and ensures the mapping guides decision-making.
Working together, local, state, and federal agencies can create more effective assessments. This leads to better preparation for climate changes.
Getting a wide range of stakeholders involved is essential. It helps us develop useful and detailed insights. By working together, we can build resilience and face climate challenges head-on.
Creating Actionable Plans from Mapping Data
After mapping climate vulnerabilities, the next step is to make plans that can really help. This involves three main steps: creating strategies, picking what to do first, and checking how well it works.
Developing Adaptation Strategies
Communities can start making plans based on their climate risk assessment. These plans should aim to lessen the effects of climate threats and make the area more resilient. Plans might include fixing infrastructure, changing policies, teaching people, and community projects.
Prioritizing Interventions
With not enough money, picking the most important actions is key. By looking at the mapping data, we can see who and where is most at risk. We should choose based on how big the threat is, who it affects most, and if we can do it.
Monitoring and Evaluating Outcomes
Keeping an eye on how well our plans work is essential. By watching how our strategies are doing, we can see if they’re helping. This way, we can make sure we’re getting better at facing climate challenges.
| Adaptation Strategy | Intervention Priority | Monitoring and Evaluation Indicators |
|---|---|---|
| Infrastructure upgrades (e.g., flood-proofing, stormwater management) | High | Reduction in flood-related damages, improved drainage capacity |
| Policy changes (e.g., land-use regulations, building codes) | Medium | Adoption of new policies, compliance rates, reduction in vulnerability |
| Community education and outreach | High | Increased awareness, participation in preparedness activities |
By carefully planning, choosing, and checking our climate plans, we can make sure they work. This way, we can tackle the risks we found through climate mapping.
Challenges in Climate Vulnerability Mapping
Climate vulnerability mapping is key to understanding and tackling climate change risks. Yet, it faces many hurdles. These include data gaps, political and economic hurdles, and technical issues. Overcoming these obstacles is crucial for effective mapping.
Data Limitations and Accessibility
Getting the right data is a big challenge. Accurate data on demographics, infrastructure, and environment is often scarce, especially in poor areas. Also, accessing this data can be hard due to its spread, outdated nature, or being held by different groups.
Political and Economic Barriers
Mapping climate vulnerability can be politically sensitive. It might show weaknesses in some communities or past policy failures. This can lead to political barriers, with leaders hesitant to face these truths. The economic costs of gathering and using this data can also be a big issue, especially for local governments with limited funds.
Technical Challenges in Implementation
The technical side of climate vulnerability mapping is complex. It involves working with various data types and using advanced technologies. Technical challenges like combining different data, creating strong analysis models, and sharing results can slow down efforts.
Despite these hurdles, many are working hard to make climate vulnerability mapping work. They use new methods, team up, and focus on making decisions based on data. This effort helps build stronger, more adaptable communities.
The Future of Climate Vulnerability Mapping
Climate change threats are growing, and so is the need for better climate mapping. New emerging technologies and deeper urban planning integration are key. Plus, citizen science is playing a big role.
Emerging Trends and Technologies
New tech like high-resolution satellite images and drone sensing will change climate mapping. These tools will help us see climate risks more clearly. This means communities can prepare better for the challenges ahead.
Greater Integration with Urban Planning
Urban areas face big climate risks, making urban planning integration crucial. By using climate mapping in planning, cities can build stronger infrastructure. They can also adapt better to climate changes, keeping residents safe and healthy.
The Role of Citizen Science
Citizen science will play a bigger part in climate mapping. Community members will help gather and analyze data. This approach makes data richer and more accurate, helping us understand climate risks better.
By using new tech, integrating with urban planning, and involving citizens, climate mapping will become a vital tool. It will help fight climate change’s devastating effects worldwide.
Promoting Awareness and Education
Addressing climate vulnerability needs a multi-faceted approach. One key part is raising awareness and education in communities. By teaching people about climate change risks, we empower them to act and build resilience.
Educating Communities About Vulnerability
Community-based education is vital for climate awareness. These programs give locals info on their area’s climate risks, like floods or extreme weather. Knowing these threats, people can prepare and push for needed changes.
Building Climate Literacy in Schools
- Adding climate education to school curricula is key for future climate-aware citizens.
- Hands-on activities, field trips, and guest lectures help students grasp climate science.
- Getting students to explore solutions and act in their communities boosts empowerment and climate-positive behaviors.
Leveraging Social Media for Outreach
Social media is a strong tool for climate awareness in today’s world. It lets organizations and groups:
- Share info like infographics, videos, and interactive content on climate risks and solutions.
- Highlight community members’ voices and their resilience-building efforts.
- Start grassroots movements and encourage collective action against climate vulnerability.
By combining community education, school programs, and social media, we can deepen climate vulnerability understanding. This empowers communities to take action.
Call to Action: Get Involved in Climate Mapping
The time to act on climate change is now. By getting involved in climate mapping, we can protect our communities. Whether you’re a concerned citizen or a leader, there are many ways to help.
How Individuals Can Contribute
Everyone can help with climate mapping. First, learn about the climate risks in your area. You can volunteer with local projects or join citizen science efforts. Use social media to spread the word and get others involved.
Opportunities for Collaboration
Working together is key to effective climate mapping. Talk to local governments, non-profits, and schools about teaming up. Together, we can make detailed maps that help our communities adapt and grow stronger.
The Urgency of Addressing Climate Risks
Climate change impacts are being felt worldwide, and we must act fast. By mapping climate risks, we can focus on the most vulnerable areas. This way, we can protect lives, jobs, and our planet. Let’s work together for a better future.


