INDVI Estimation using Google Earth Engine
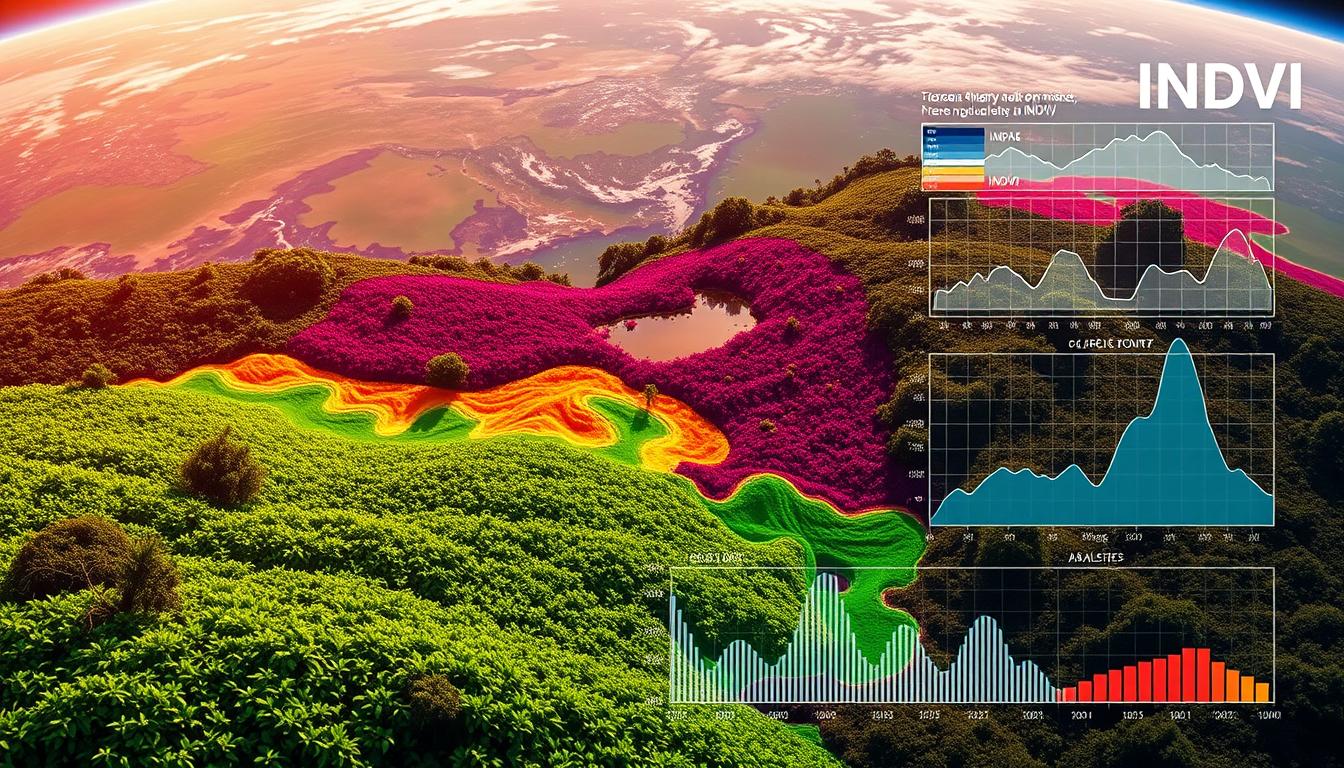
The Normalized Difference Vegetation Index (NDVI) is a key tool in remote sensing. It helps us understand vegetation health and where it grows. This guide shows how to use Google Earth Engine to estimate INDVI. It covers the basics, uses, and history of this important index.
Key Takeaways
- Understand the basic concepts and importance of NDVI in remote sensing applications
- Discover the capabilities of Google Earth Engine for vegetation analysis and monitoring
- Learn the step-by-step process of setting up and implementing INDVI calculations using Google Earth Engine
- Explore various satellite data sources and their suitability for INDVI estimation
- Gain insights into the processing methods, algorithms, and best practices for accurate INDVI analysis
- Leverage visualization techniques to effectively communicate INDVI results
- Discover real-world applications and case studies demonstrating the impact of INDVI in diverse fields
Understanding NDVI and Its Importance in Remote Sensing
The Normalized Difference Vegetation Index (NDVI) is key in remote sensing. It shows how healthy plants are. This index uses near-infrared and visible red light to measure plant health.
Basic Principles of Vegetation Indices
Vegetation indices, like NDVI, measure green vegetation. Healthy plants absorb more red light and reflect more near-infrared light. This is different for stressed or sparse plants.
Applications in Environmental Monitoring
NDVI has many uses in environmental monitoring. It checks crop health, tracks deforestation, and detects drought effects. It also finds insect infestations. This data helps in making better decisions for land use and conservation.
Historical Development of NDVI
The idea of NDVI started in the 1970s. Researchers used satellite images to watch vegetation. Better technology and more data have made NDVI even more useful today.
| Year | Milestone |
|---|---|
| 1972 | First Landsat satellite launched, paving the way for satellite-based vegetation monitoring |
| 1973 | The concept of NDVI introduced by Rouse et al. |
| 1980s | Widespread use of NDVI in agricultural and ecological applications |
| 2000s | Increased availability of high-resolution satellite data and advancements in remote sensing technologies |
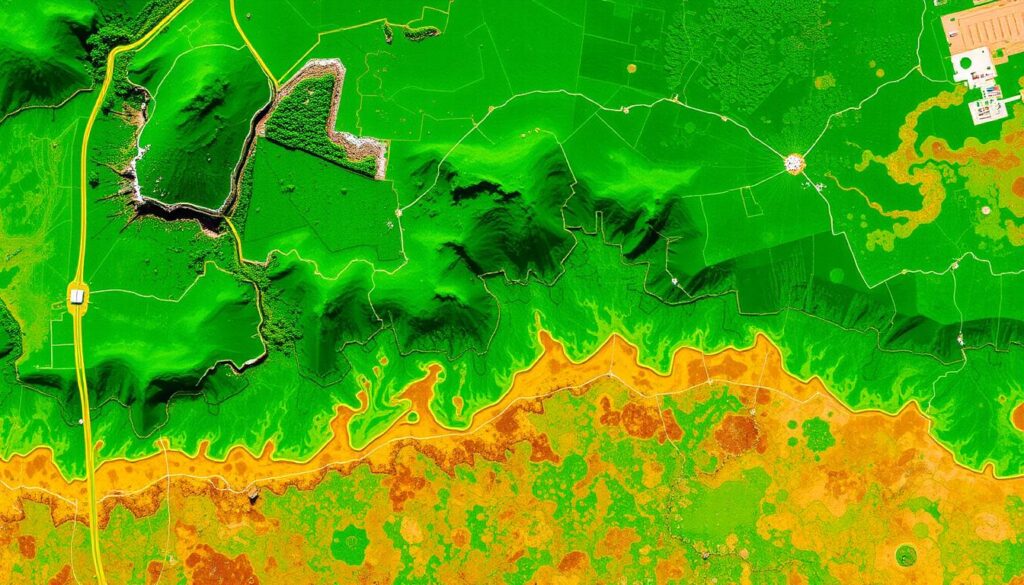
“NDVI is a powerful tool that has revolutionized the way we understand and monitor our planet’s vegetation.”
Getting Started with Google Earth Engine Platform
Google Earth Engine is a cloud-based platform that changes how we work with geospatial data. It uses cloud computing to give users quick access to lots of satellite images and Earth data. It also has tools for processing and analyzing this data.
To start with Google Earth Engine, first create an account. It has a free tier for individuals, making it easy for many to use. After setting up your account, you can explore the easy-to-use Google Earth Engine interface.
Navigating the Google Earth Engine Interface
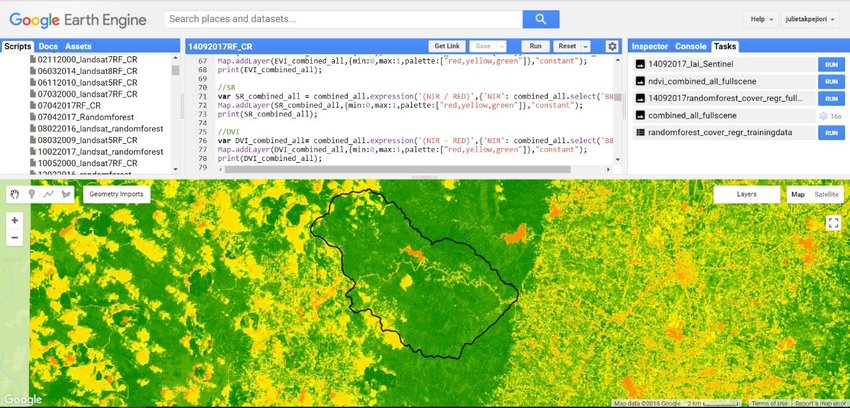
The Google Earth Engine interface has several parts, each with its own role. The Code Editor lets you write and run your own scripts with the Earth Engine API. The Asset Manager is where you manage your geospatial data. The Task Manager helps you keep track of your data tasks, making workflow smooth.
Google Earth Engine’s Earth Engine API is a key feature. It lets you access the platform’s big dataset and do complex geospatial analysis. The API works with languages like JavaScript and Python, fitting into your projects easily.
As you explore Google Earth Engine, you’ll find lots of resources and help. There are tutorials, code examples, forums, and support channels. The Earth Engine community is here to help users at all levels.
INDVI Google Earth Engine: Core Concepts and Implementation
Google Earth Engine is a cloud-based platform for big geospatial analysis. It helps researchers and analysts with INDVI (Inverted Normalized Difference Vegetation Index) estimation. This section covers the basics and how to use Google Earth Engine for INDVI.
Setting Up Your First INDVI Project
To start with INDVI in Google Earth Engine, you need a few steps. First, create a Google Earth Engine account and learn the web-based code editor. Then, import data like satellite images and land cover datasets for your project.
Code Structure and Organization
For INDVI estimation using Google Earth Engine, a good code structure is key. Break your project into parts like data prep, index calculation, and visualization. This makes your code easy to manage and understand.
To calculate NDVI (Normalized Difference Vegetation Index) in Google Earth Engine (GEE), you can use the following script. NDVI is typically calculated using the following formula:
NDVI=(NIR−Red) / (NIR+Red)
Where:
- NIR refers to the Near Infrared band
- Red refers to the Red band
Here’s a full script that you can use in Google Earth Engine to calculate NDVI using satellite imagery (such as from Landsat or Sentinel-2).
Full NDVI Calculation Script in Google Earth Engine
Example of Code to Calculate the INDVI using Google Earth Engine
// Define the area of interest (AOI). You can define it by coordinates, or use an existing geometry.
// Here we define a region over Algeria for example
var aoi = ee.Geometry.Polygon([
  [[3.0, 36.0], [3.0, 37.5], [4.5, 37.5], [4.5, 36.0]]
]);

// Load the Sentinel-2 image collection
var collection = ee.ImageCollection('COPERNICUS/S2')
  .filterBounds(aoi)  // Filter by AOI
  .filterDate('2023-01-01', '2023-12-31')  // Specify the date range
  .filter(ee.Filter.lt('CLOUDY_PIXEL_PERCENTAGE', 20));  // Filter out cloudy images

// Select a single image (for example, the median composite for the year)
var image = collection.median();

// Select the Red and NIR bands
var red = image.select('B4');  // Red band (Band 4)
var nir = image.select('B8');  // Near Infrared band (Band 8)

// Calculate NDVI
var ndvi = nir.subtract(red).divide(nir.add(red)).rename('NDVI');

// Define visualization parameters
var ndviParams = {
  min: -1,
  max: 1,
  palette: ['blue', 'white', 'green']
};

// Display the results on the map
Map.centerObject(aoi, 10);  // Zoom into the area of interest
Map.addLayer(ndvi, ndviParams, 'NDVI');

// Optionally, export the NDVI image as a GeoTIFF
Export.image.toDrive({
  image: ndvi,
  description: 'NDVI_Algeria_2023',
  scale: 30,  // Adjust the scale based on the resolution of the input imagery
  region: aoi,
  fileFormat: 'GeoTIFF',
  maxPixels: 1e8
});
Data Import and Preprocessing
To calculate INDVI, you must first import and prep your data. This includes tasks like:
- Getting satellite images from Landsat or Sentinel
- Correcting the data for the atmosphere
- Removing clouds, water, and non-vegetated areas
- Resampling and aligning data to a common resolution
“Effective INDVI estimation is built on a foundation of high-quality data and robust preprocessing techniques.”
Satellite Data Sources for INDVI Calculation
To accurately calculate the Indice of Normalized Difference Vegetation Index (INDVI), high-quality satellite imagery is needed. Google Earth Engine offers a vast collection of satellite imagery and remote sensing data from various Earth observation missions. We will look at the main satellite data sources for INDVI calculation in Google Earth Engine.
The Landsat series of satellites, run by the USGS and NASA, is a key source for INDVI estimation. The Landsat program has a long history of global satellite imagery. It includes data from Landsat 4, 5, 7, and 8, each with different sensors and resolutions. These datasets are easily accessible for INDVI analysis in Google Earth Engine.
The Sentinel-2 mission by the European Space Agency (ESA) is also crucial for INDVI calculation. Sentinel-2 satellites offer high-resolution multispectral data needed for INDVI. This data is easily processed in Google Earth Engine, making it ideal for remote sensing analysis.
| Satellite Mission | Spatial Resolution | Spectral Bands | Revisit Frequency |
|---|---|---|---|
| Landsat 4, 5, 7, 8 | 30 meters | Blue, Green, Red, Near-Infrared, Shortwave-Infrared | 16 days |
| Sentinel-2 | 10-60 meters | Blue, Green, Red, Near-Infrared, Shortwave-Infrared | 5 days |
By using the wide range of satellite imagery in Google Earth Engine, researchers can do detailed remote sensing studies. This helps in accurately calculating INDVI for many environmental monitoring and management tasks.
Processing Methods and Algorithms for INDVI Analysis
The Improved Normalized Difference Vegetation Index (INDVI) uses advanced methods and algorithms. These are based on geospatial analysis and remote sensing. They help get accurate and reliable data on vegetation, aiding in environmental monitoring.
Mathematical Foundations
INDVI analysis starts with basic math. It uses reflectance values from the red and near-infrared bands. This gives insights into vegetation health. The INDVI formula improves on the Normalized Difference Vegetation Index (NDVI) for better accuracy.
Temporal Analysis Techniques
- INDVI data tracks changes in vegetation over time.
- Time series analysis and trend detection reveal insights into vegetation dynamics.
- These methods help monitor environmental impacts and climate change effects on vegetation.
Error Handling and Quality Control
Ensuring accurate INDVI estimates is key. Error handling and quality control address data issues like sensor errors and cloud contamination. Through validation and quality assurance, results are trustworthy, aiding in informed decision-making.
| Geospatial Analysis Technique | Application in INDVI Estimation |
|---|---|
| Time Series Analysis | Tracking seasonal and long-term trends in vegetation growth and health |
| Spatial Interpolation | Estimating INDVI values for areas with sparse or missing data |
| Image Classification | Mapping and monitoring different vegetation types and land cover changes |
Advanced processing methods and algorithms unlock INDVI’s full potential. They are crucial for geospatial analysis, environmental monitoring, and decision-making.
Visualization Techniques for INDVI Results
Showing INDVI data well is key to understanding it. Google Earth Engine offers tools for data visualization and geospatial analysis. It helps users make maps, charts, and animations that make INDVI results clear.
Creating thematic maps is a big part of showing INDVI data. These maps show where INDVI values are high or low. The Earth Engine API lets users change colors, legends, and more to fit their needs.
The Earth Engine API also makes animated visualizations. These animations show how INDVI changes over time. They’re great for seeing seasonal changes or long-term trends in vegetation health.
Earth Engine supports many types of charts and graphs too. Users can make line plots, scatter plots, and histograms. These help explore INDVI data, find patterns, and compare trends.
| Visualization Type | Key Features | Suitable Applications |
|---|---|---|
| Thematic Maps | Spatial distribution of INDVI, custom color schemes, interactive legends | Identifying vegetation hotspots, monitoring regional variations |
| Time-Series Animations | Temporal INDVI changes, integration with other geospatial data | Tracking seasonal trends, detecting sudden vegetation changes |
| Statistical Charts | Line plots, scatter plots, histograms for INDVI analysis | Exploring INDVI patterns, comparing values across regions or time |
Using Google Earth Engine’s tools, researchers and practitioners can share their INDVI findings. They can gain insights and help with environmental monitoring, agriculture, and urban planning.
Best Practices for Accurate INDVI Estimation
Precision agriculture, environmental monitoring, and remote sensing need precise Normalized Difference Vegetation Index (NDVI) calculations. To get reliable INDVI analysis, follow best practices in data collection and processing.
Data Quality Assessment
Checking your data quality is the first step for accurate INDVI estimation. Look at the spatial resolution, temporal coverage, and any data gaps or inconsistencies. Choosing high-quality data sources is key for reliable INDVI results.
Atmospheric Correction Methods
Atmospheric interference can affect NDVI accuracy. Using methods like Rayleigh scattering or aerosol optical depth correction can help. These methods reduce atmospheric effects, giving more precise INDVI estimates.
Validation Techniques
- Ground truthing: Compare INDVI results with on-site measurements for validation.
- Cross-referencing: Check INDVI data against other vegetation indices or land cover datasets to spot discrepancies.
- Statistical analysis: Use methods like regression analysis or uncertainty quantification to understand the reliability and uncertainty of your INDVI estimates.
By using these best practices, your INDVI estimation will be accurate and reliable. This is crucial for precision agriculture, environmental monitoring, and remote sensing.
Integration with Other Earth Engine Tools
The Google Earth Engine is great because it works well with many tools. For INDVI estimation, you can use more Earth Engine features. This helps you get more insights from your studies.
You can mix INDVI with other data, use machine learning, and explore more Earth Engine tools. This makes your remote sensing work better.
Integrating INDVI with Ancillary Datasets
The Google Earth Engine has lots of data. You can add things like weather, land types, or people data to your INDVI work. This makes your analysis richer and more detailed.
By adding these extra data, you learn more about how plants grow and stay healthy.
Harnessing Machine Learning Capabilities
The Google Earth Engine makes it easy to use machine learning. You can do things like classify land, find changes, or predict things. This helps you find patterns and make better choices.
It’s all about using INDVI data in new ways to get deeper insights.
Leveraging Additional Earth Engine Features
The Google Earth Engine has lots more to offer. You can do things like look at data over time, mix images, or automate tasks. These tools make your INDVI studies easier and more powerful.
With these tools, you can understand the environment in new ways. It opens up new possibilities for your research.
| Feature | Description | Potential Application |
|---|---|---|
| Time-Series Analysis | Analyze INDVI trends over time to identify seasonal patterns, anomalies, or long-term changes. | Agricultural monitoring, forest cover assessment, urban vegetation mapping. |
| Image Compositing | Create cloud-free, high-quality INDVI composites from multiple satellite images. | Improved visualization and analysis of vegetation health and distribution. |
| Automated Data Processing | Develop scripts and workflows to automate the retrieval, preprocessing, and analysis of INDVI data. | Scalable and efficient INDVI estimation for large-scale projects or operational monitoring. |
By using INDVI estimation with other Google Earth Engine tools, you can do more with your research. This way, you can understand the environment better and make better choices. It’s all about using geospatial analysis to make a difference.
Real-World Applications and Case Studies
Google Earth Engine’s use of INDVI shows its wide range of applications. It uses satellite data and advanced analysis to tackle big environmental issues. This makes INDVI a key tool in many fields.
Agricultural Monitoring
INDVI is a key tool in precision agriculture. It helps farmers and researchers check on crops and make better decisions. It’s used for land cover mapping in precision agriculture, helping crops grow better.
Forest Cover Change Detection
INDVI helps track changes in forests over time. It looks at old satellite images to find deforestation and reforestation. This helps in environmental monitoring and saving forests.
Urban Vegetation Assessment
INDVI also helps in urban areas. It checks on green spaces and helps plan for more. It’s key for making cities better and greener.

