How GIS Helps Map Urban Heat Islands
Cities are growing fast, and so is the problem of urban heat islands. These are areas where the temperature goes up because of buildings and people. This can harm the environment and our health. Luckily, GIS is a tool that helps us understand and tackle this issue.
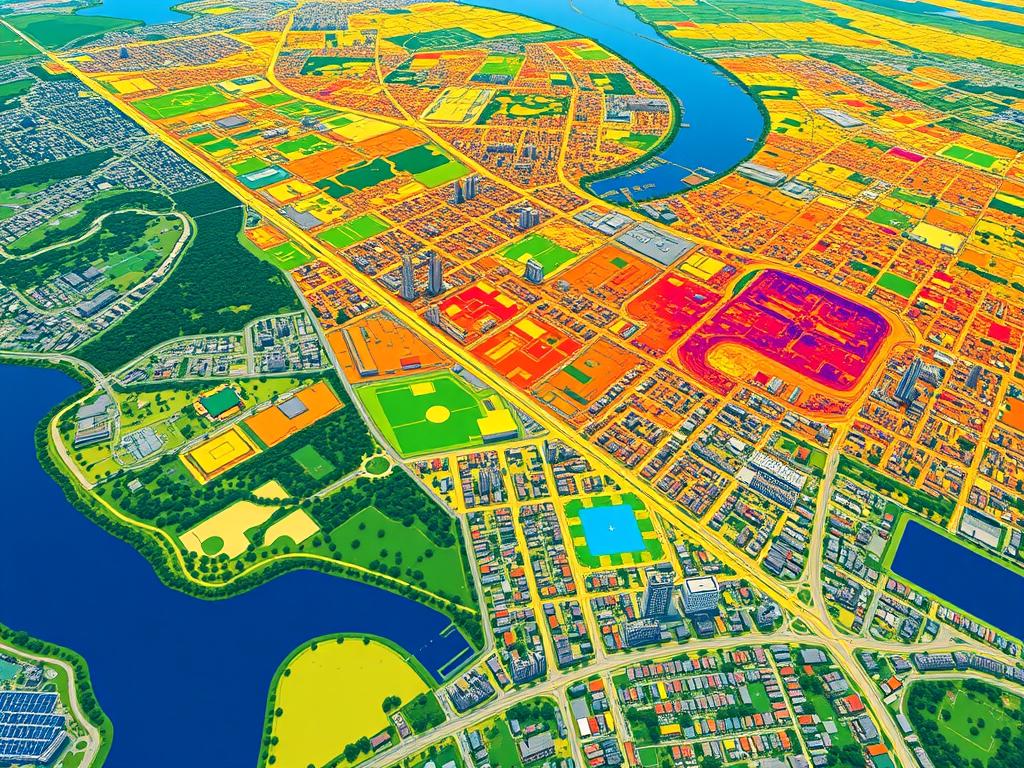
GIS uses data to show where the heat is in cities. It looks at satellite images, sensors on the ground, and other data. This way, it makes detailed maps that show where it’s hottest. These maps help city planners make better choices for their cities.
Key Takeaways
- GIS technology has revolutionized the way we map and analyze urban heat islands.
- Heat maps created using GIS data can reveal the distribution and intensity of urban heat islands within a city.
- Understanding urban heat islands is crucial for developing effective urban planning and climate resilience strategies.
- GIS-based heat mapping provides valuable insights to city leaders and urban planners.
- Integrating GIS data with other sources, such as satellite imagery and ground-based sensors, enhances the accuracy and depth of urban heat island analysis.
Understanding Urban Heat Islands
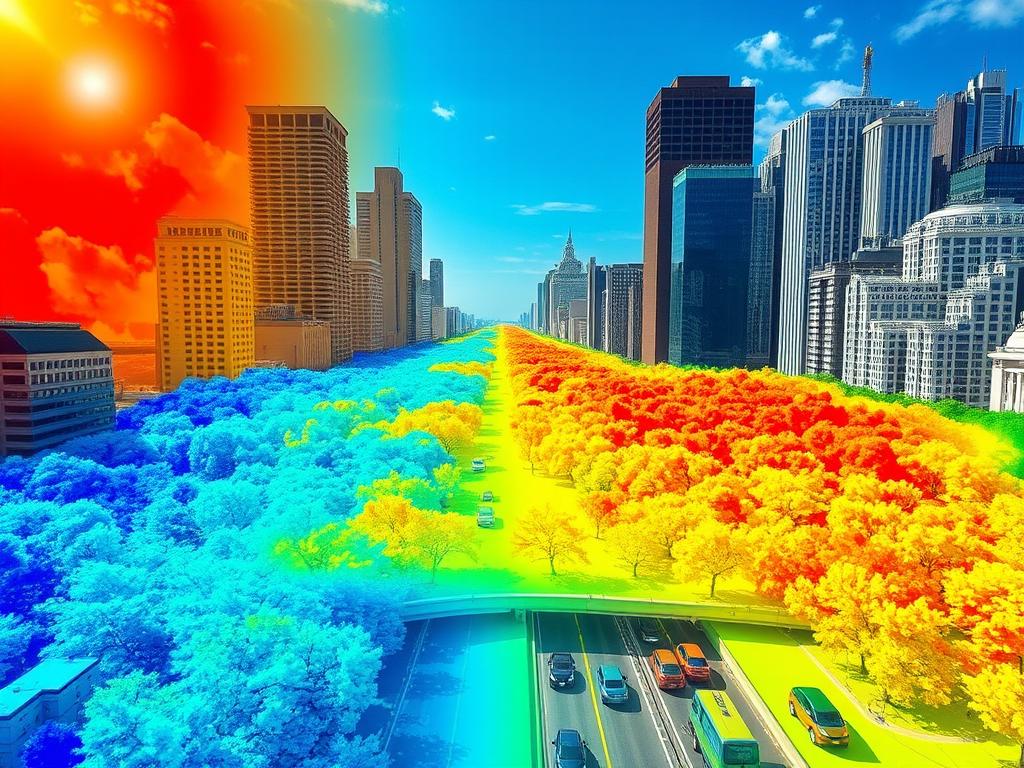
Urban heat islands are areas where cities get hotter than the countryside. This happens because cities have lots of buildings and roads that soak up heat. This makes cities warmer than the natural areas around them.
What are Urban Heat Islands?
Urban heat islands happen because of all the buildings and roads in cities. These surfaces get hot and stay hot longer than nature can. Without enough green spaces, cities get even hotter.
Causes of Urban Heat Islands
- Abundance of heat-absorbing materials like asphalt, concrete, and steel in urban environments
- Reduced vegetation and green spaces that would otherwise provide cooling through evapotranspiration and shading
- Human activities such as transportation, industrial processes, and energy consumption that release additional heat into the urban environment
Impacts on Urban Environments
Urban heat islands can harm cities and their people. They make it harder to cool down, pollute the air, and hurt people’s health. They also make heat waves worse, which is bad for everyone.
| Impact | Description |
|---|---|
| Energy Consumption | Higher temperatures in urban areas lead to increased demand for air conditioning, driving up energy consumption and costs. |
| Air Pollution | Urban heat islands can contribute to the formation of ground-level ozone and other harmful air pollutants, further degrading air quality. |
| Health Risks | Exposure to extreme heat can cause heat-related illnesses, such as heat exhaustion and heatstroke, particularly among vulnerable populations. |
Knowing about urban heat islands helps city leaders make better plans. They can work to make cities cooler, healthier, and more livable for everyone.
The Role of GIS in Urban Heat Mapping
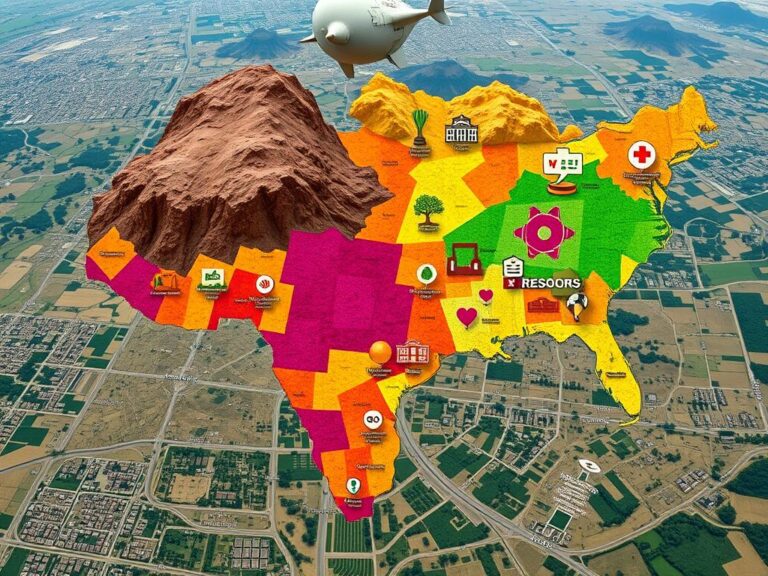
Geographic Information Systems (GIS) are key in fighting urban heat islands. They help with spatial analysis and data visualization. This gives urban planners and policymakers the tools they need to tackle heat issues in cities.
Introduction to Geographic Information Systems
Geographic Information Systems (GIS) are computer systems that handle geospatial data. They use data from satellites, ground measurements, and demographics. This creates detailed GIS mapping solutions.
Benefits of GIS for Heat Mapping
GIS in urban heat mapping brings many advantages:
- It does detailed spatial analysis to find hotspots and patterns.
- It uses strong data visualization to help understand heat issues better.
- It combines different data sets for a complete view of urban planning.
- It helps make decisions faster for better heat mitigation strategies.
With GIS, urban planners can make better choices. They can focus on the most important areas and work with communities. This helps tackle the big challenges of urban heat islands.
“GIS technology has revolutionized the way we approach urban heat mapping, enabling us to uncover hidden patterns and make data-driven decisions to improve the livability of our cities.”
– Dr. Emily Greenfield, Urban Climate Specialist
Data Collection Techniques for UHI Mapping
To map urban heat islands (UHIs) well, we need a detailed approach to collecting data. Researchers and urban planners use many methods. These include remote sensing, ground-based measurements, and satellite imagery to get temperature data in cities.
Remote Sensing Methods
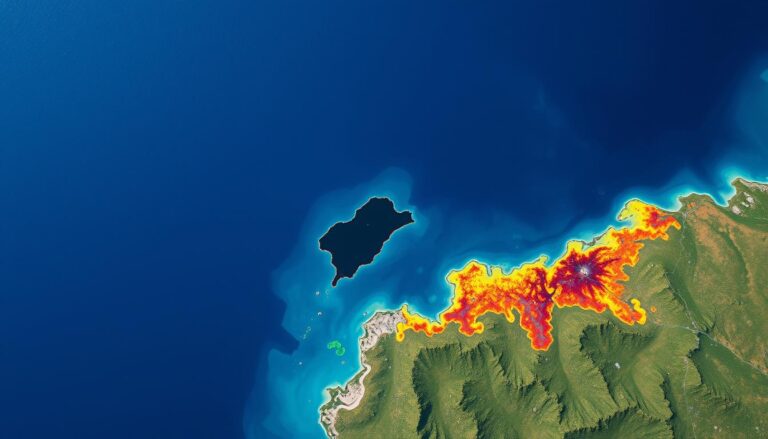
Remote sensing, like thermal infrared cameras and aerial photos, helps collect temperature data over big cities. It shows surface temperatures, helping us see where heat is concentrated. This info helps urban planners find and fix hot spots.
Ground-Based Measurements
Ground-based temperature readings add more detail to our understanding of city heat. Weather stations, mobile sensors, and data from citizens give us precise, local temperature data. This data helps confirm what remote sensing shows and adds more context.
Satellite Imagery
Satellite data is key for UHI mapping. Satellites with thermal sensors can capture detailed temperature data over cities. By studying these images, researchers can spot temperature changes, find heat hotspots, and check if cooling efforts work.
| Data Collection Technique | Advantages | Limitations |
|---|---|---|
| Remote Sensing |
|
|
| Ground-Based Measurements |
|
|
| Satellite Imagery |
|
|
Using a mix of these methods, urban planners can make detailed UHI maps. These maps help them plan and implement ways to reduce the effects of urban heat islands.
Analyzing UHI Data with GIS
Spatial analysis and heat mapping are key in understanding urban heat islands (UHI). Geographic Information Systems (GIS) are powerful tools for visualizing and analyzing temperature patterns in cities.
Spatial Analysis Techniques
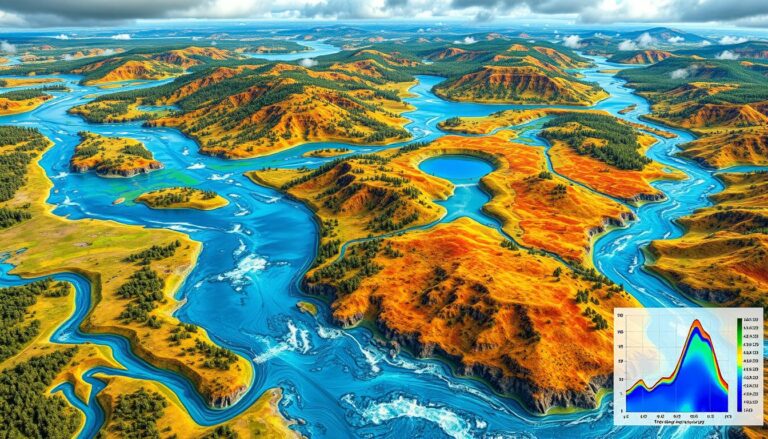
GIS helps researchers find hot spots and map temperature changes. Techniques like spatial interpolation, spatial clustering, and overlay analysis turn raw data into useful insights about cities.
Heat Mapping Algorithms
Heat mapping algorithms use GIS to show UHI patterns clearly. Algorithms like Kriging and Inverse Distance Weighting (IDW) create detailed heat maps. These maps are crucial for urban planning and policy-making.
| Spatial Analysis Technique | Description |
|---|---|
| Spatial Interpolation | Estimates temperature values at unsampled locations based on nearby measurements, creating a continuous temperature surface. |
| Spatial Clustering | Identifies groups of areas with similar temperature characteristics, highlighting hot spots and cooler zones. |
| Overlay Analysis | Combines temperature data with other spatial datasets, such as land use, vegetation, and building density, to uncover relationships and drivers of UHI. |
“Effective spatial analysis and heat mapping are essential for understanding the complex dynamics of urban heat islands and informing targeted mitigation strategies.”
Tools and Software Used for UHI Mapping
Mapping and analyzing urban heat islands (UHIs) need special GIS software and heat mapping tools. These tools are key for capturing and showing the complex heat patterns in cities.
Popular GIS Software Options
Geographic Information Systems (GIS) software is essential for UHI mapping. Top GIS platforms like ArcGIS, QGIS, and Google Earth Engine have great features for managing data, analyzing spaces, and making maps. They help urban planners and researchers combine different data types, like satellite images and temperature readings, to create detailed heat maps.
Specialized Heat Mapping Tools
- ENVI: This remote sensing software is great for working with thermal images, making it useful for UHI studies.
- SUHI Mapper: This online tool, made by NASA, lets users quickly make heat maps from satellite data.
- URBAN-HEAT: The EPA’s web app offers an easy way to model and show UHI effects.
| GIS Software | Key Features for UHI Mapping |
|---|---|
| ArcGIS | Robust spatial analysis tools, advanced data integration, and comprehensive visualization capabilities |
| QGIS | Open-source platform with a wide range of geospatial processing and mapping functionalities |
| Google Earth Engine | Cloud-based platform for large-scale data processing and analysis of satellite imagery |
These GIS software and heat mapping tools help urban planners, researchers, and decision-makers understand UHI patterns better. They support creating effective ways to reduce UHI effects and improve urban planning.
Case Studies: Successful UHI Mapping Initiatives
Urban heat islands (UHIs) are big problems for cities around the world. Many cities are using Geographic Information Systems (GIS) to map and tackle these issues. We’ll look at some city projects that have used UHI mapping well, and what they learned.
Notable City Projects
In Los Angeles, the city teamed up with UCLA to create a UHI mapping program. They used data from satellites, ground measurements, and remote sensing. This helped them make detailed heat maps to find the hottest areas.
These maps showed where to focus on making cities cooler. They suggested adding cool roofs and more green spaces. This made a big difference in the city’s heat levels.
New York City has also tackled its heat island problem. They worked with the Mayor’s Office and the Department of City Planning. They used GIS to find the hottest spots and plan for a cooler future.
This approach helped them focus on the right areas. It made sure everyone got help, especially those most affected by heat.
Lessons Learned from Case Studies
- Good UHI mapping needs data from different sources, like satellites and ground measurements.
- Working with schools and local governments helps a lot with UHI mapping.
- Using UHI data in climate plans is key to making cities cooler.
- It’s important to make sure everyone gets help, especially those hit hardest by heat.
By studying these city projects, leaders and planners can use GIS better. This helps fight urban heat islands and make cities more resilient to climate change.
Community Engagement in UHI Mapping
Getting the local community involved is key for UHI mapping success. By working with residents, city planners can collect important data. They can also spread awareness and work on ways to reduce heat.
This section highlights the role of community engagement. It shows how working with local governments helps tackle urban heat island challenges.
Involving Local Residents
Community-based projects are great for UHI mapping. Local people can help by taking temperature readings and spotting hot spots. They share their own experiences with heat, making the mapping more relevant.
This approach empowers communities. It makes sure the mapping fits their specific needs and worries.
Collaborations with Local Governments
UHI mapping needs teamwork between planners, policymakers, and local governments. Together, they can create plans to fight urban heat. Local governments offer resources like money, data, and help with logistics.
Community members bring local knowledge. They help put heat-reduction plans into action.
By teaming up, cities can use community engagement, urban planning, and local government efforts. They can start citizen science projects. These projects make accurate heat maps and guide smart decisions.
Engaging the community and working with local authorities makes UHI mapping effective. It tackles the unique heat challenges of cities.
Mitigation Strategies for Urban Heat Islands
Urban areas face a big challenge with heat islands. GIS mapping is key in finding ways to fight this problem. Two main strategies are urban design interventions and the role of green spaces.
Urban Design Interventions
GIS helps urban planners and designers make cities cooler. They can change the city’s look to absorb less heat. Here are some ways:
- Using cool roofing materials that reflect sunlight and absorb less heat
- Choosing light-colored pavement and paving materials to absorb less heat
- Building structures with shading elements, like awnings and overhangs, to block sunlight
Role of Green Spaces
Green spaces in cities are a great way to fight heat. GIS mapping finds the best spots for parks and trees. This helps a lot with heat mitigation and urban planning.
| Benefit | Impact |
|---|---|
| Evapotranspiration | Cools the air by releasing water vapor |
| Shading | Reduces heat by blocking sunlight |
| Carbon Sequestration | Helps fight climate change |
With GIS, urban planners can make cities better. They can tackle urban heat islands and make cities more livable, sustainable.
Future Trends in UHI Mapping
The world is getting more urban, making UHI mapping crucial. GIS technology is advancing, leading to better UHI mapping tools.
Advancements in Technology
Remote sensing and high-resolution satellite images are changing UHI mapping. New sensors and algorithms will give cities detailed data on urban heat. IoT devices like smart thermometers will add real-time data, creating a detailed urban heat map.
Policy Implications and Urban Planning
Improved UHI mapping will shape urban planning and policies. City leaders will understand heat challenges better, leading to smart solutions. This includes green spaces, reflective buildings, and energy-efficient designs.
By using data for policy, cities can improve residents’ lives and fight climate change.

